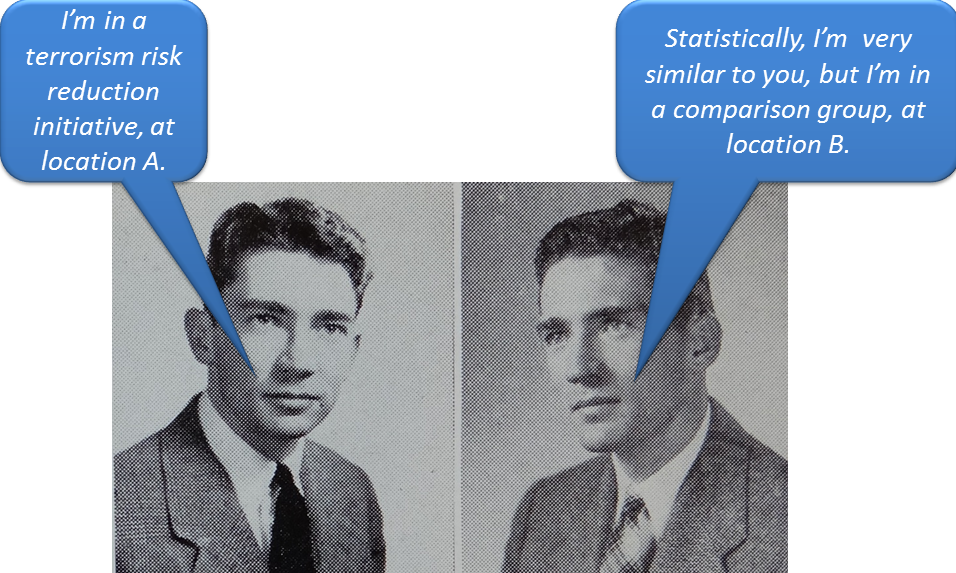
For example, how do we know if a prison-based terrorism risk reduction initiative works better to reduce post-detainment terror engagement in one jurisdiction vs. a different initiative in another jurisdiction. After all, we didn’t randomly assign the initiatives’ participants (i.e., the incarcerated offenders) to be incarcerated at one location vs. the other.
Therefore, who knows whether one initiative is performing better than the other, or whether there are differences between the offenders in the different jurisdictions (e.g., job skills, marital status, degree of family support, number and severity of prior offenses) that make offenders from one location (vs. the other) more likely to refrain from re-engaging in terrorism?
- Explanation of propensity score matching designs, for those who don’t care about propensity score matching designs.
- Who cares?!
- The “catch.”
Fear not; this discussion will not deteriorate into a stats tutorial. (Check out the resources below, if that’s what you wish.) Instead, this is written for those who know virtually nothing about the topic, but who would like to know a) why they should care, and/or b) how to learn more if they wish.
Remember some of those plausible characteristics: job skills, marital status, degree of family support, number and severity of prior offenses? If it’s a plausible factor, and can be measured reliably, it should be tossed into the analysis: an analysis called logistic regression that calculates the odds (i.e., the propensity, hence the name) of something happening. (More on this in “the catch” section.)
By equating the comparison groups, this is a powerful technique for supporting causal inference, insofar as the only difference that remains between the groups is the characteristic of interest: in this case, whether parolees participated the initiative at one location vs. the other.
Another answer is that policy makers should care: at least enough to ask if/how studies’ comparison groups were equated.
In short, to do this type of analysis, one typically needs quality data about the individuals in the study.
Here ye, researchers/evaluators: you might already have realized that, given the above “catch,” part of your job is to research, as thoroughly as you can, variables that might plausibly be associated with the outcome of interest (and, so, should be controlled via matching). If data aren’t available about those in your study, with respect to those variables, it will also be part of your job to figure out how to obtain reliable measurements of them.
- Austin, P. C. (2011). An Introduction to Propensity Score Methods for Reducing the Effects of Confounding in Observational Studies. Multivariate Behavioral Research, 46, 399-424.
- Rudner, L. M., & Peyton, J. (2006). Consider Propensity scores to compare treatments. GMAC – Graduate Management Admission Council.
- Timberlake, D. S., Huh, J., & Lakon, C. M. (2009). Use of propensity score matching in evaluating smokeless tobacco as a gateway to smoking. Nicotine & Tobacco Research, 11, 455-462.
This article touches upon propensity score matching designs in the context of evaluating P/CVE initiatives. Williams, M. J., & Kleinman, S. M. (2013). A utilization-focused guide for conducting terrorism risk reduction program evaluations. Behavioral Sciences of Terrorism and Political Aggression, doi: 10.1080/19434472.2013.860183. (Full text available via the hyperlink in this reference.)
Have an idea for a future feature on The Science of P/CVE blog? Just let us know by contacting us through the form, or social media buttons, below.
We look forward to hearing from you!
All images used courtesy of creative commons licensing.


